
INNcontrol 5 Dashboard Guide for Hotel Engineers: Reading It Right and Troubleshooting What It Shows
If your property runs Honeywell's INNCOM guestroom system with INNcontrol 5 (IC5), the dashboard is where the whole building talks to you. It is a cloud-hosted web interface — reached from a browser on a workstation or a phone — that rolls occupancy, energy, communication health, alarms, and guest service requests into one screen. Used well, it tells you about problems before a guest does. Used badly, it becomes wallpaper.
This guide is written for chief engineers, maintenance techs, and front office leads who look at IC5 every day. It walks through what each part of the Overview page actually means, how to read alarms properly, what an OFFLINE communication status does and does not tell you, and which problems are worth a call to an Authorized Service Integrator (ASI). Howe Sound Solutions is a Canadian Honeywell INNCOM ASI, and this is the same orientation we give property teams after a commissioning or an IC3-to-IC5 upgrade. As always, for admin-level configuration and anything involving your specific device mix, consult your INNCOM documentation or an ASI rather than a web guide.
First, a 60-Second Picture of What's Behind the Dashboard
You will troubleshoot the dashboard better if you know roughly what feeds it. In a typical IC5 property, each guestroom has a gateway function (often living in the thermostat) that reports the room's data points — temperature, humidity, occupancy, door and window state. Rooms communicate over INNCOM's wireless mesh network to an edge router, which serves a block of rooms and hands the data to the on-site IC5 supervisor, built on the Niagara Framework. The supervisor pushes data up to Honeywell's secure cloud platform, and the dashboard you log into is the cloud's view of all of it.
That chain — room, mesh, edge router, supervisor, cloud — matters because every "why does the dashboard say X?" question is really a question about where in that chain the data stopped flowing or started saying something you didn't expect.
The Overview Page: Your Property at a Glance
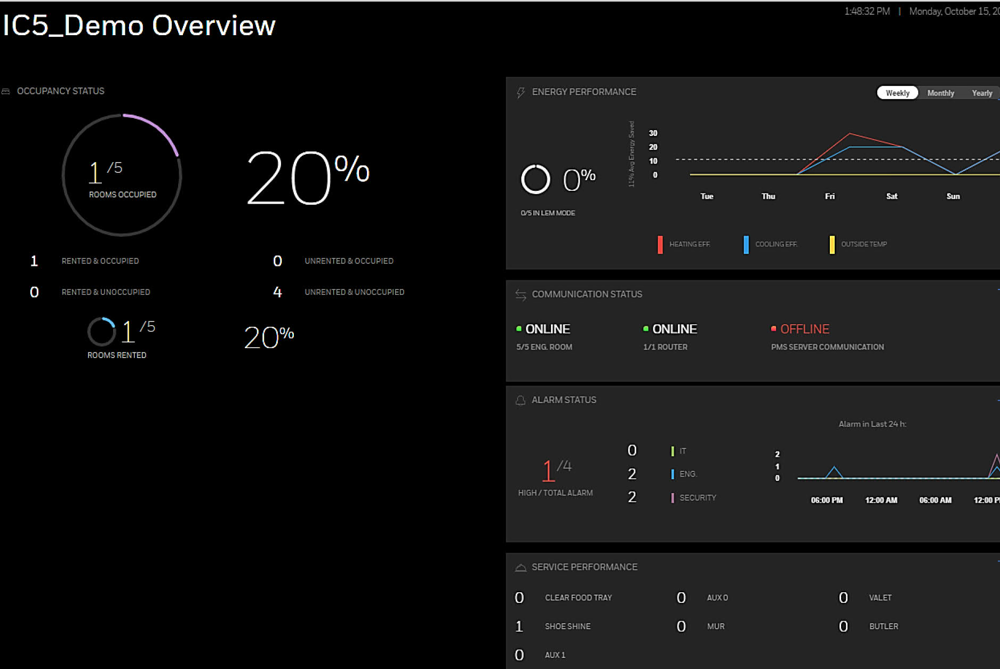
When you log in, IC5 lands you on the Overview page for your organization. A navigation pane gets you to Places (buildings, floors, rooms), Settings, and the Alarms view; a notification bell in the title bar surfaces recent alarms. The Overview itself is a set of widgets, and each one deserves a proper reading.
Occupancy Status
This widget shows how many rooms are occupied, the occupancy percentage, and — more usefully — the four-way breakdown that drives INNCOM's energy logic: rented/occupied, rented/unoccupied, unrented/occupied, and unrented/unoccupied. Rented status comes from your property management system (PMS) integration; occupied status comes from in-room sensing. The combinations are where the value lives: rented-and-unoccupied rooms are candidates for housekeeping without disturbing anyone, while unrented-but-occupied rooms are worth a question — staff in the room, an early check-in the PMS hasn't caught up with, or something front office should know about.
Energy Performance
This widget trends the property's heating and cooling efficiency alongside outside temperature, viewable weekly, monthly, or yearly, and shows how many rooms are currently in LEM mode. At a high level, LEM (limited energy management) is a reduced-energy state — a room deliberately held in a deeper setback rather than conditioned for a guest. Don't obsess over any single day's number; the habit that pays off is watching the shape of the trend against outside temperature and noticing when it changes character.
Communication Status
Three indicators: how many rooms are online, how many edge routers are online, and whether PMS server communication is up. Check this widget first, every time — nothing else on the dashboard is trustworthy if communication is broken. One caution: if nothing at a tier is reporting in, the widget shows the whole tier as offline, so a single upstream failure can look far more catastrophic than the actual fault. More on triage below.
Alarm Status
This shows the count of high-priority alarms against total unacknowledged alarms over the last 24 hours, a breakdown by type — engineering, IT/network, and security, each colour-coded — and a 24-hour trend graph. Note that the headline count is about high-priority and unacknowledged alarms; lower-severity items don't inflate it. That design cuts both ways: the number stays meaningful, but only if your team actually acknowledges alarms as they're handled. A property that never acknowledges anything trains itself to ignore the widget entirely.
Service Performance
A consolidated view of open guest service requests across all rooms: make-up room, do-not-disturb, clear food tray, valet, and similar categories, including configurable auxiliary types. For front office and housekeeping this is the most actionable widget on the page — essentially a live worklist. Requests can also be raised or cleared per room from the room-level views.
Reading Alarms Properly
The Alarms view lists everything, sortable by severity or time raised and filterable by type. Selecting an alarm opens a detail panel, and the four fields there are the whole story:
- Severity — how urgent the system considers it. High-severity items (a room critically hot or cold, a security event) go to the top of your day. Low-severity items are maintenance fodder.
- Status — active means the condition still exists right now; inactive means it occurred and cleared. An inactive "door ajar" from last night is history; an active one is a walk-up.
- Type — engineering (comfort and equipment), IT (network and communication), or security. The type tells you who should own it: your maintenance team, whoever manages the network, or the duty manager.
- Location — the room and floor, which with the Places menu takes you straight to the source.
A practical discipline: triage by severity-plus-status, not recency. Ten stale inactive alarms above one active high-severity room temperature alarm is how real problems get buried. Acknowledge what's handled, chase what's active, and treat a repeating alarm from one room as one problem, not many.
What OFFLINE Actually Means — and First Triage Steps
OFFLINE on the communication widget means the dashboard has lost the data path to something. It does not automatically mean the room has lost heating or cooling — the in-room controls are designed to keep doing their local job — but it does mean you're blind to that room or system, and blind is not a state to leave a hotel in.
Triage by pattern, using the chain from earlier:
- One room offline. Almost always local: the room's gateway or thermostat lost power (tripped breaker, a renovation crew, a unit physically disturbed), or the device itself has failed. Walk the room. Check that the thermostat is powered and behaving before suspecting anything bigger.
- A cluster or floor offline together. Rooms fail in groups when what they share fails — typically the edge router serving that block, its power, or its network connection. Check the router's power and its switch port before touching any rooms.
- Everything offline. If every room and router drops at once, the fault is upstream: the supervisor machine, the property network, or the internet link between site and cloud. Remember the widget's behaviour — total silence at a lower tier can be a single failure at a higher one. Confirm the supervisor is up and the property has internet before assuming a hundred rooms broke simultaneously.
- PMS communication offline. Rooms keep controlling temperature, but rented/unrented status stops updating — which quietly degrades the energy logic, since the system can no longer distinguish a rented room from an unrented one. Loop in whoever manages the PMS interface; this is usually a server or interface-service issue, not an INNCOM field problem.
Whatever the pattern, note when it started and what changed at the property around then — network work, power events, PMS maintenance. That habit shortens every support call you will ever make.
Drilling Down: Floor View and Room View
The Places menu mirrors your property: buildings contain floors, floors contain rooms. The floor view is a table of every room on the floor — temperature, humidity, rented and occupancy status, privacy state, door and window status, and open requests — with an indicator per room showing whether its gateway is communicating. It's the fastest way to spot the odd room out: one door open on a floor of closed ones, one room 8 degrees off its neighbours, one gateway dark.
The room view goes one layer deeper: current temperature and humidity, setpoint and fan/AC mode, occupancy and rented state, door/window status, and that room's service requests. Its companion trends view is the underrated gem — historical graphs of the room's setpoint, heating and cooling activity, fan behaviour, temperature, and humidity over a date range you choose. When a guest says "the room never got cool last night," trends shows whether the equipment ran flat-out and lost (mechanical problem), never ran (control or comms problem), or ran exactly as asked (a setpoint conversation). Settings changes beyond day-to-day operation belong with your INNCOM documentation or your ASI.
Daily and Weekly Habits That Make the Dashboard Earn Its Keep
Engineering, daily (five minutes): check Communication Status first; then active high-severity alarms; then scan the floor views for outlier rooms. Acknowledge what's been handled.
Front office/housekeeping, each shift: work the Service Performance widget as a live queue, and use the rented-versus-occupied breakdown to sequence housekeeping around guests instead of into them.
Engineering, weekly (fifteen minutes): review the energy trend against outside temperature, look for rooms that alarm repeatedly, and pull the trends view on your two or three worst rooms. Repeating patterns in a single room are your preventive maintenance list writing itself.
When to Escalate to an ASI
Handle in-house: single rooms offline with an obvious local cause, service request workflow, alarm acknowledgment, and anything the floor and room views make self-evident.
Call an ASI when the problem is structural: rooms or routers that drop repeatedly without a local explanation, mesh coverage that has degraded, alarm floods or chronically wrong statuses that suggest a configuration issue, supervisor or Niagara-level faults, PMS integration problems that the PMS vendor says aren't theirs, or any need to change how the system is configured rather than how it's used. Those live below the dashboard, in the layers that require INNCOM tooling and training to touch safely.
Frequently Asked Questions
Why does a room show offline when the thermostat looks fine?
Offline means the data path to the dashboard is broken, not necessarily that the room's controls are dead. The thermostat can be locally functional while its link into the mesh, its edge router, or something upstream is down. Check whether neighbouring rooms are also offline — one room points local, many rooms point upstream.
Why do my energy numbers look flat?
Three common reasons: mild weather (little heating or cooling demand means little savings to measure), steady occupancy patterns (the savings logic has fewer unoccupied hours to exploit), or a data problem — if communication has been spotty, the trend can flatten simply because data stopped flowing. Check the communication widget's history before assuming the energy logic changed.
What is LEM mode?
At a high level, LEM (limited energy management) is a reduced-energy state in which a room is held in a deeper setback rather than fully conditioned. The energy widget shows how many rooms are in it. How and when rooms enter LEM is configuration-dependent — that's a conversation for your INNCOM documentation or your ASI.
Does a PMS communication failure shut off guestroom HVAC?
No — rooms continue controlling locally. What you lose is rented/unrented awareness, which degrades energy optimization and the accuracy of the occupancy widget until the interface is restored.
Can front office staff use the dashboard, or is it engineering-only?
Both, and it works best shared. The service request and occupancy widgets are front-of-house tools; communication, alarms, and trends are engineering tools. Access is per-user within your organization, so each team can be given what it needs.
Talk to Howe Sound Solutions
Howe Sound Solutions is a Canadian Honeywell INNCOM Authorized Service Integrator. We commission IC5 properties, train engineering and front office teams on exactly the habits above, and troubleshoot the layers underneath the dashboard when a problem turns out to be more than a tripped breaker. If your property is still on INNcontrol 3, our IC3-to-IC5 upgrade guide covers what a move actually involves.
Talk to Howe Sound Solutions: [email protected] — ask us for an IC5 health check or dashboard training session for your team.
Related: INNCOM monitoring as a service · parts catalogue · customer platform · contact us